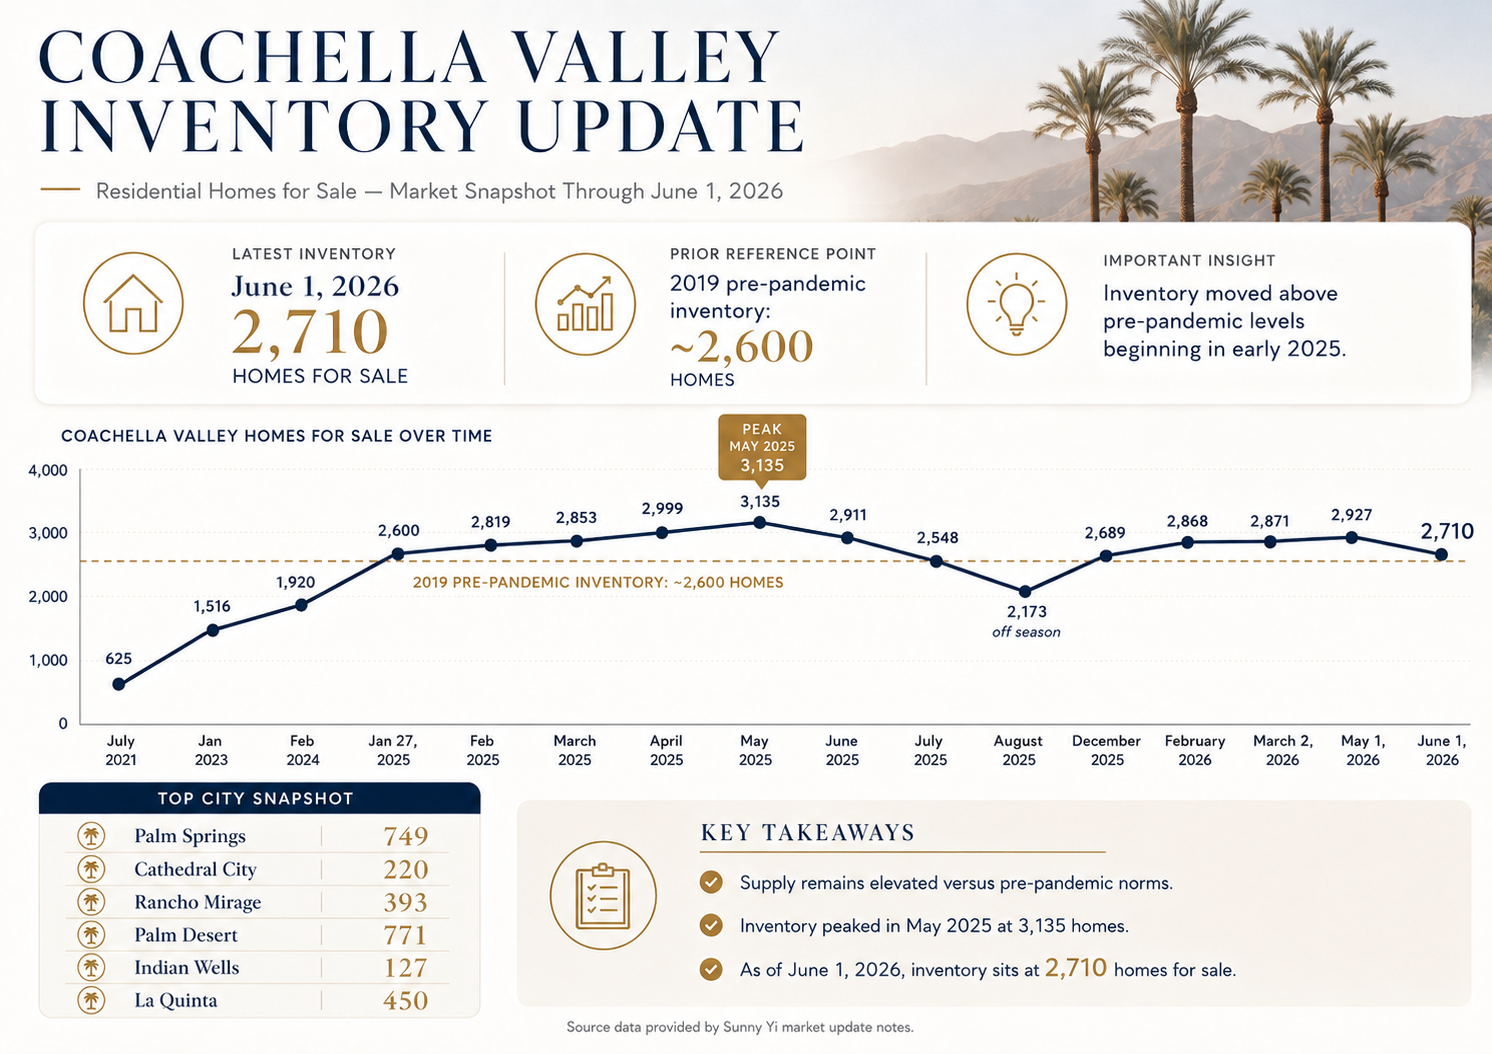
June 1, 2026 Market Inventory Update

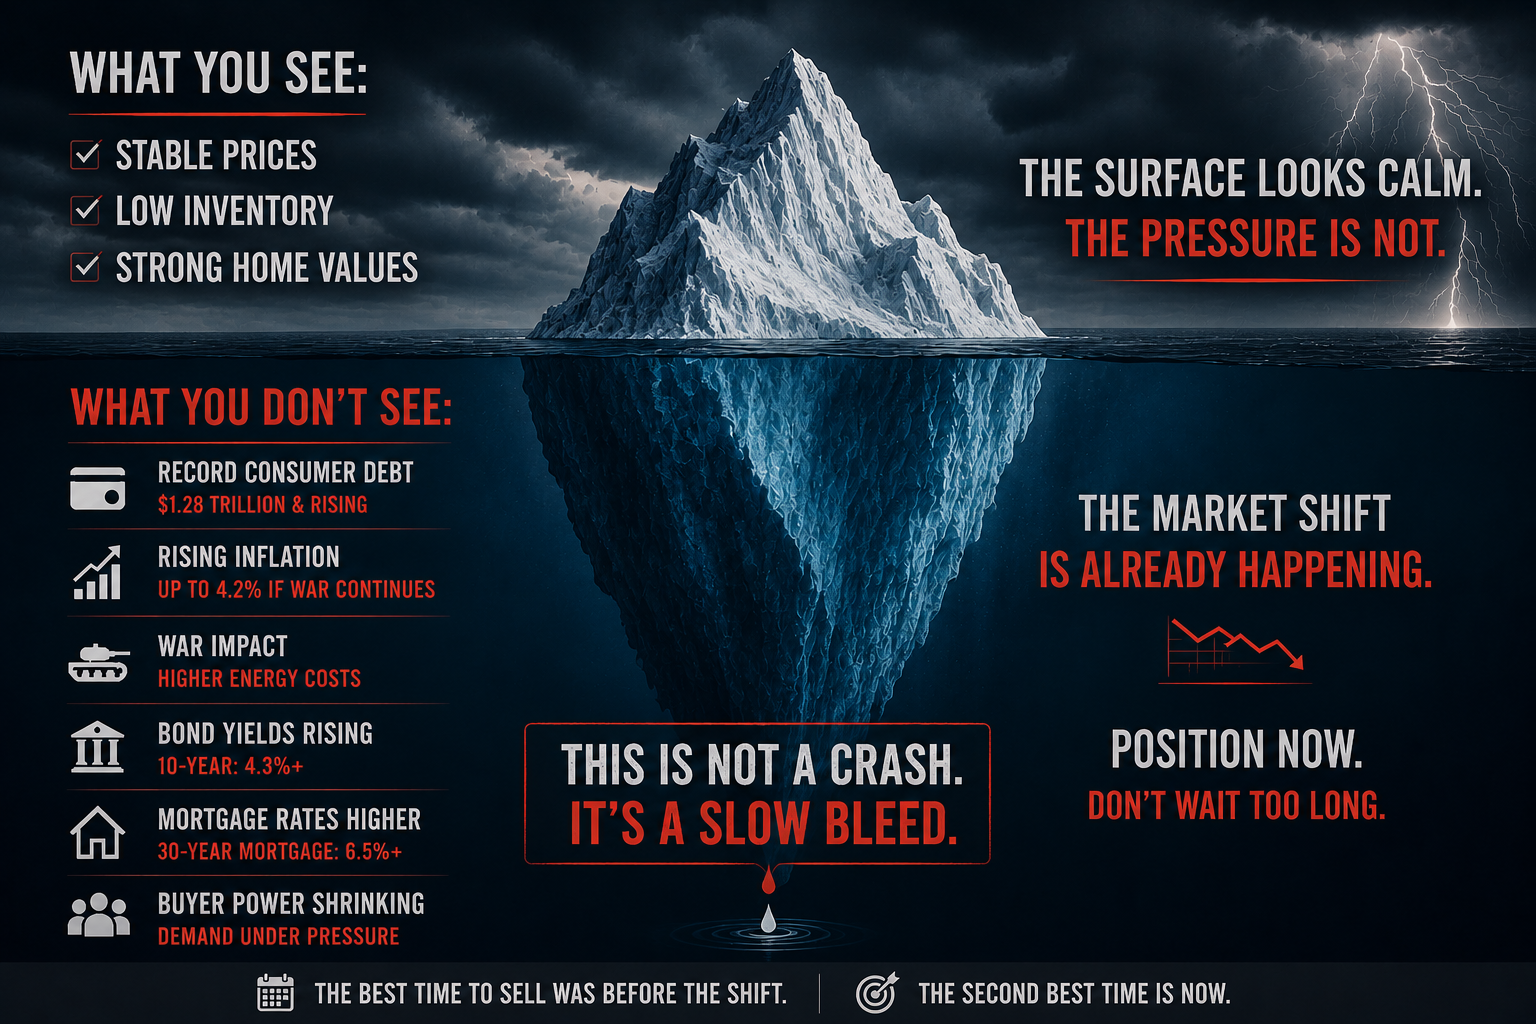
Half The Truth Is The Same Lie.
For the past sharing posts, I have shown you one side of the market.
The slow erosion.
The frozen middle.
The 2021–2023 buyer trapped at the closing table.
The HELOC quietly turning a financial problem into a property problem.
That side is real & happening.
Most agents will not say it.
Why? Listings.
But telling only half the picture is still a lie: just pointed in the other direction.
Here is the other side.
Homes are definitely selling.
Some are closing over asking.
Some are moving quickly.
Luxury communities in the Coachella Valley are still active.
Madison Club. Bighorn. Eldorado. The Reserve. PGA West. Hideaway.
Cash buyers are still buying.
Cash does not care what the Fed does next month.
Sherman Oaks and Porter Ranch are not collapsing.
Prices are holding pending value proposition.
Well priced homes still move in days/weeks.
Both stories are happening at the same time.
Sometimes in the same zip code.
Sometimes in the same community.
Sometimes on the same street.
That is the part most people miss.
This is not one market.
It is multiple markets stacked on top of each other.
Within the same community, two sellers can experience completely different outcomes.
Same week.
Same neighborhood.
Different result.
One home sells clean.
Another sits for months.
That is not luck.
It is the details.
When you bought.
What you paid.
Your price point.
Your lot.
Your upgrades.
Your landscape.
Your condition.
Your timing.
Your pricing.
Your decor.
Your representation.
No one can predict exactly where this market lands.
Anyone telling you they can is selling you something.
My job is not to sell you the version that gets me a listing.
My job is to tell you which segment you are actually standing in when asked upon.
I am here simply to recommend and advise.
What you do with that is yours.
T R U S T.
That is the entire business.
S U N N Y Y I
Unfiltered Data. No Fiction.
The door is knocking. I've been in this business long enough to hear the pattern before most people feel it.
Foreclosure numbers. Rental stress. The slow bleed happening underneath what the headlines are willing to say. I'm going to share all of it here, .. not to scare you, but because you deserve to know what's actually happening in this market.
Other agents won't touch this data. Too uncomfortable. Too much risk of losing a listing.
I don't work that way.
My commission isn't earned by opening doors and filling out paperwork. Anyone can do that. It's earned by knowing what this data means for your equity, .. and building the strategy to protect it before the window closes.
No bull. No spin. Just thirty years of pattern recognition and the willingness to say it out loud without a filter.
Why? .. because, you can't make an educated decision based on fictional novel.
$1Trillion plus consumer credit card debt: Making an impact on the rental market.
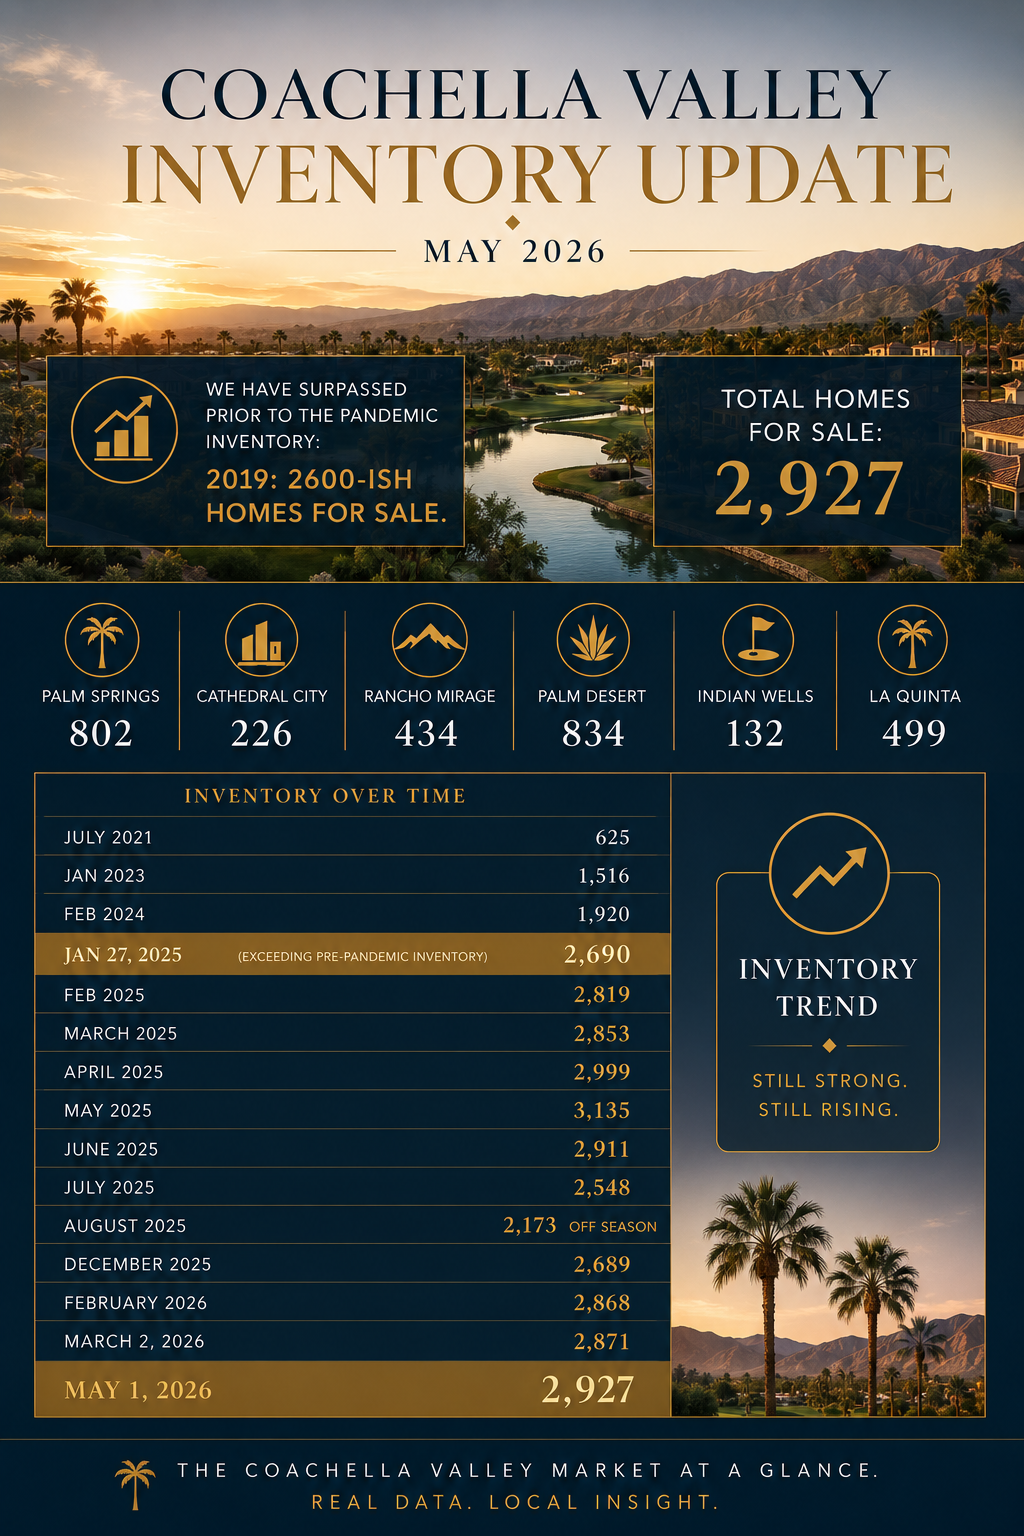
We have surpassed prior to the pandemic inventory
C
I Hoped I Was Wrong.
I Wasn't.
By Sunny Yi: 30 Years. Five Cycles. This Is the One That Changes Everything.
A month ago I published ten pieces on this site.
I laid out what I was seeing. The frozen market. The builder confessions. The HELOC trap. The consumer debt stack. The equity illusion. The cascade that connects all of it into a single direction.
I ended every piece the same way.
I hope I'm wrong.
I meant it.
I would genuinely prefer to be the agent who spent weeks building a picture that never materialized. Who read the signals, followed the instinct, wrote it all down, and was wrong.
I was not wrong.
Everything I described is now in the headlines. The numbers are worse than I projected. And two events have occurred since I published that series that have taken this market from a slow bleed to something that requires immediate and honest attention.
The Iran war. And the bond market.
This is the piece I wish I didn't have to write.
What Has Changed Since My Last Series
When I published the original ten pieces, the core pressure was internal. Consumer debt at record levels. Auto delinquencies matching 2008. Builders spending $47,000 per home just to get a buyer to the closing table for a $500k product line. A housing market stuck at a 30 year low. Equity quietly eroding. The HELOC being used as a survival tool instead of a wealth tool.
All of that is still true. All of it has worsened.
But two external shocks have now layered on top of everything I described. And the combination changes the timeline. It accelerates what was moving slowly. It removes breathing room that some sellers still had.
SHOCK ONE: The Iran War and What It Does to Your Wallet
In late February 2026, the United States entered a military conflict with Iran.
I am not going to debate the geopolitics here. What I am going to tell you is what it means for your financial position as a homeowner, a buyer, or a seller in this market.
Energy costs are spiking. Gas is above $4 a gallon nationally for the first time in over three years. In California, it is higher. Every product that moves on a truck, every material used to build or renovate a home, every contractor who drives to your property is now more expensive than they were 90 days ago.
Inflation is re-accelerating. US inflation jumped to 3.3% in March 2026. The OECD projects it hits 4.2% if the war continues. That is not a rounding error. That is a significant reversal of the modest progress made in 2024 and early 2025.
The Fed is paralyzed. They want to cut rates to relieve the housing market and the consumer debt pressure I described in my last series. They cannot. Cutting into rising inflation caused by an active war is not responsible monetary policy. So they sit. And the consumer sits with them. And the housing market stays frozen.
The war did not create the underlying pressure in this market.
But it removed the exit ramp.
SHOCK TWO: The Bond Market and What It Does to Your Mortgage
This is the one most homeowners don't see coming. And it is the most direct threat to sellers who are waiting.
Here is how it works.
The US government is carrying an enormous deficit. To fund that deficit, it issues Treasury bonds. To attract buyers for those bonds: foreign governments, institutional investors, pension funds, it has to offer competitive yields. When investors sense inflation, risk, or uncertainty, they demand higher yields before they will buy.
That is happening right now.
The 30 year Treasury yield has pushed above 5%. The 10 year, which is the primary driver of mortgage rates, is sitting at 4.3% to 4.4% and rising. Mortgage rates have followed. The 30 year fixed mortgage is back above 6.5% and moving higher.
Here is what that means in plain language.
Every time the bond yield rises, fewer buyers can qualify for your home. Every time fewer buyers can qualify, demand shrinks. Every time demand shrinks against rising inventory, prices adjust downward.
This is not a theory. It is the mechanism. It is operating right now. Mortgage applications have already dropped more than 10% in consecutive weeks as rates pushed higher.
The sellers who were waiting for rates to come down before listing?
Rates are going the other direction.
THE COMBINED PICTURE: What These Two Shocks Mean Together
Let me put all of it on the table at once.
You have a housing market that has been frozen since 2022. Inventory in the Coachella Valley alone has gone from 625 units in July 2021 to nearly 3,000 units today. Homes are sitting longer. Price reductions are the norm. Builders are still spending tens of thousands per home in concessions just to close.
On top of that frozen foundation, you now have:
Rising energy costs that increase the carrying cost of every property. Re-accelerating inflation that keeps the Fed from cutting. Bond market pressure pushing mortgage rates higher. A buyer pool that is already strained now facing even less purchasing power. And a consumer debt stack $1.28 trillion in credit cards & increasing daily, $1.67 trillion in auto debt, HELOC balances building: that has no relief mechanism in sight.
The slow bleed I described in my original series has not stopped.
It has been joined by a pressure system that is accelerating it.
FOR SELLERS: What Is Coming and How to Position Right Now
I want to be direct with you. More direct than I was in my last series.
If you are a seller who has been waiting for the market to improve before listing, the market is not improving. The data says the opposite.
Here is the specific sequence heading toward you:
If any of this sounds aggressive, I want to acknowledge that. I don't come to this lightly. Call it professional enthusiasm from someone who has been watching this market for 30 years and cannot stay quiet when the pattern becomes this clear.
Nobody can predict the future. I am not doing that here.
But when you are standing on the shore and you can see the water pulling back: .. that long, quiet, unmistakable retreat that every coastal community knows precedes a wave, you do not wait for confirmation before you say something.
That is where I believe we are.
Not from a textbook. Not from a spreadsheet. From three decades of instinct, street level observation, and the kind of pattern recognition that only accumulates through living inside every cycle: the crashes, the recoveries, the quiet deteriorations that never make the front page until it is too late for the people who needed to act earlier.
The data has confirmed what the instinct already knew.
I simply could not stay silent.
Inventory will continue to build. The forced sellers I described: the ones running out of road are not disappearing. They are accumulating. Every month that passes, more homeowners exhaust their savings, max their credit, draw their HELOC, and arrive at the only remaining option. Listing. Not voluntarily. Not strategically. From necessity. That inventory does not help your position.
Your buyer pool is shrinking, not growing. Higher mortgage rates do not attract more buyers. They eliminate them. The buyer who qualified at 6% does not qualify at 6.75%. That buyer is gone from your pool. The remaining buyers know they have leverage and they are using it.
Price reductions are compounding. As I showed in my last series, the MLS statistic that says homes are selling at 96-98% of list price is fiction. It only measures the final list price. The home that started at $1.8 million and sold at $1.35 million after three reductions is reported as a 98% success. It was a 75 cent dollar. That compression is accelerating.
The equity you are banking on is time-sensitive. It exists today. It will be smaller in six months than it is right now. Not because of a crash. Because of the slow, steady, methodical pressure that does not make headlines but absolutely shows up at the closing table.
What to do:
Price it correctly the first time. Not the number that feels good. The number that sells. In this market, the seller who prices aspirationally and chases the market down through four reductions nets less than the seller who prices aggressively on day one and creates urgency in the buyer pool that still exists.
Do not wait for spring. Do not wait for the Fed. Do not wait for the war to end. The window you have today is more favorable than the one you will have in 90 days. I do not say that to pressure you. I say it because the data I have been tracking for months — and the two new shocks I just described — point in one direction.
Get clarity on your true equity position before you make any decision. Not the Zillow number. The closing table number. They are not the same.
FOR BUYERS: What to Anticipate and How to Position
The buyers who are waiting for prices to drop dramatically before entering are making a mistake. Not because prices won't soften. They will in certain markets and certain segments. But because by the time prices reach the floor that buyers are waiting for, two things will have happened.
Mortgage rates will have responded to whatever economic condition created that price floor, and those conditions are unlikely to be rate friendly. And the properties worth buying will have been purchased by the buyers who moved while others waited.
My mother said it plainly: you make your money when you buy, not when you sell.
Here is how to position right now as a buyer:
Target motivated sellers, not motivated prices. The seller in distress is more negotiable than the market price suggests. The expired listing. The property with multiple price reductions. The second home carrying a monthly cost the owner can no longer justify. These sellers have already told you they need to move. That is your leverage point.
Understand carrying cost math before you offer. In this rate environment, what you pay and what it costs you monthly are two separate calculations. A seller concession on rate buy down is worth more than a price reduction in many scenarios. Know your numbers before you sit at the table.
The Coachella Valley secondary market is the specific opportunity right now. Inventory at nearly 5 times the 2021 trough. Owners who bought an ego purchase in 2020-2022 when everything felt flush and are now doing the monthly math on a property they visit a few months a year. That calculation is shifting. The sellers who were hoping the market would recover before they had to act are running out of time to hope.
Move while there is still a seller who wants to negotiate. When distressed inventory fully floods the market, and based on the cascade I described, it is coming, you will be competing with every other buyer who waited. The best entries never come with headlines announcing that it is time to buy. They come quietly. In markets like this one. Before the urgency is obvious to everyone.
THE CLOSING: No More Passive. This Is What I Need You to Hear.
I ended my last ten pieces with: I hope I'm wrong.
I was right.
I have been in this business for 30 years. I have seen five cycles. I have never seen this specific combination of pressure assembled simultaneously, and, I have never been more certain that the people who act on what they know today will be in a fundamentally different position than the people who wait for the headline to tell them it's time. The window is closing.
Not slamming. Not crashing. Closing. Quietly. The way every important window in this market has moved below the surface, without a headline, in a direction most people don't recognize until they are standing on the wrong side of it.
If you are a seller sitting on equity right now: that equity has a shelf life in this environment. The Iran war is not ending tomorrow. The bond market is not reversing tomorrow. The inventory building in your market is not disappearing tomorrow. Every one of these forces is pointing in the same direction and they are pointing there together.
If you are a buyer who has been waiting: the motivated seller who will negotiate today will be replaced by the forced seller tomorrow, … who will also negotiate, but in a market with higher rates, more inventory, and more competition from other buyers who finally stopped waiting.
Either way, the decision you delay today is made by the market for you tomorrow.
I have been in your corner for 30 years. I have told clients the truth when it was comfortable and when it was not. This is the not comfortable version.
Reach out now. Not when you feel ready. Now.
Because in this market, by the time it feels like the right moment, the right moment has usually already passed.
30 years. Every cycle. Your corner.I'm here when it matters: and, .. right now, it matters.
S U N N Y YIDRE: 01100371 | Rodeo Realty Inc. Sherman Oaks: 818.516.0205Beverly Hills: 310.801.4118 | sunnyyi.com

My mothers wisdom:
“Sunny … in real estate, you make your money when you buy… not when you sell.”
The best opportunities usually appear during uncertain times.
Not when everyone feels safe.
Not when headlines are optimistic.
Not when bidding wars are everywhere.
The “Kim Chee Theory.”
Sometimes the best decisions need time to ferment quietly before the value becomes obvious.
It’s all about positioning.
Are we in uncertain times?
Yes …
Find me when it matters
S U N N Y YI


The Honest Conversation.
This is the only piece I wasn't sure I was going to write.
Not because the information isn't important. Because what comes after the information is the part that requires something more than data. It requires trust. And trust is earned, .. not announced.
You gave ten pieces of your attention to someone who was asking you to look at something uncomfortable. That is not a small thing. Most people scroll past the uncomfortable. You didn't.
So let me close the way I opened: … with honesty.
I started this series with four words.
That is all I was after.
I hope I'm wrong.
I still do.
I would genuinely prefer to be the person who spent a week laying out a picture that never materialized. Who looked at the data, followed the instinct that 30 years built, wrote it all down, .. and was wrong.
But here is what I know after three decades of doing this.
Instinct in real estate is not a feeling. It is pattern recognition accumulated over thousands of transactions, thousands of client conversations, multiple market cycles, and the specific kind of attention that comes from caring deeply about an industry and the people inside it.
And the pattern I am seeing right now is one I have never seen assembled quite this way before.
Not the crash of 2008. Not the correction of the early 2000s. Not the savings and loan crisis of the late 1980s. Something different. Something slower & methodical. Something that operates beneath the surface and replaces the soaked bandage every single day so the patient never quite understands how much they are bleeding.
The golden handcuff holding sellers in place. The frozen market with no velocity and no exchange. The builders spending $47,000 per home just to close a deal for a mid six digit product line. The 2021 buyer who cannot exit without writing a check. The consumer stretched past comfort on every front simultaneously. The equity cushion that feels permanent but is quietly shrinking. The HELOC that converted a financial problem into a property problem. And the cascade: … the six-stage sequence that connects all of it into one direction.
That is the puzzle.
And now that you have seen all ten pieces, … you can see the picture.
So what do you do with it.
Here is my honest answer.
It depends entirely on your specific situation. And that is not a deflection. It is the most truthful thing I can tell you.
Because this market, unlike any I have seen before, does not have a single right answer for everyone inside it.
For some of you the right move is to sell now. Before the inventory builds further. Before the price compression reaches your market. Before the window that exists today narrows into something smaller. You have equity. You have a buyer pool that still exists. The cost of waiting may be higher than the cost of moving.
For some of you the right move is to wait. Your rate is too valuable. Your equity is stable. Your market is not among the 35% declining. The forced-seller dynamic I described does not apply to your situation. Patience is the correct strategy.
For some of you the right move is neither of those things. It is restructuring. Refinancing a HELOC before the repayment period hits. Accessing equity strategically before it thins further. Making a decision about a second property you have been holding. Getting clarity on a situation that has felt unclear for longer than it should have.
And for some of you: the ones who recognized themselves in Piece 5 or Piece 8, the right move is to have a conversation before the situation makes the decision for you.
That is the one I am most concerned about.
The homeowner who bought in 2021 or 2022 with a thin down payment or even 20% plus and is watching the monthly cost of living climb while the equity they thought they had turns out to be a number on paper that does not survive contact with the closing table.
The homeowner who opened a HELOC to manage the squeeze and has not modeled what the closing table looks like with two liens on the property in a softening market.
The homeowner whose income has been disrupted, whose business is down, whose position was eliminated, whose W-2 is no longer keeping pace, .. and who is one or two months away from a decision that will be made for them rather than by them.
Those are the conversations I am available for.
Not to list your home. Not to tell you what you want to hear. Not to run a comparative market analysis designed to get a signature.
To sit across from you, or across a phone call, and tell you the truth about what your specific situation looks like in this specific market at this specific moment.
Sometimes the truth is sell immediately.
Sometimes it is hold and here is why.
Sometimes it is you have more time than you think.
Sometimes it is you have less time than you realize.
But you cannot make the right decision without the right information. And you cannot get the right information from someone who has something to gain from a particular answer.
I have been doing this for 30 years. I have built my reputation one handshake and one family at a time. And in every relationship that has carried across market cycles, … on one thing.
Telling people the truth about what they are actually looking at.
Not the comfortable version. The accurate one.
That is what I am offering here.
Not a pitch. Not a sales call. Not a listing presentation dressed up as market education.
A conversation with someone who has seen this before: not exactly this, nobody has seen exactly this, .. but enough of the pieces to read the pattern and tell you honestly what it means for your situation.
If anything in these ten pieces landed for you: reach out.
The door is open. No agenda on my side except the one I have always had.
To be the person in the room who tells you what you need to know.
If you have read all ten pieces, my only goal was to tilt your head a little. To make you pause. To make you think.
That was it. Nothing more.
I decided to share this series because I feel it. My instinct has been in this business for 30 years and right now it is screaming at me. I could not stay quiet.
If this series started a conversation in your home, with your spouse, with your business partner, with someone you forwarded it to, … then it was a success.
I hope I'm wrong about all of it.
But, I would rather you know and be prepared, than find out later that you didn't have to be surprised.
S U N N Y YI
30 years. Every cycle. Your corner.
I’m here when it matters
Start from Piece 1: Something is wrong with this market: and read the full picture in sequence. Share this series with anyone you believe needs to see it before they make a real estate decision in this market. And when you are ready for the honest conversation, .. you know where to find me.

The Cascade.
How everything I have described this week connects into a single sequence: .. and where that sequence leads.
If you just started: This is piece 9 of 10. Start from: Something is wrong with this market Intro. Below.
Job loss. Debt failure. Forced listing. Inventory surge. Price compression. Equity evaporation. Six stages. One linked to a chain. Already underway. I haven’t mentioned AI yet.
All week I have been showing you individual pieces of a puzzle.
The golden handcuff that keeps sellers locked in place. The frozen market that has not moved at this level since 1995. The Home Depot signal that confirms sellers are not spending and buyers are not buying. The builder confession that reveals how aggressively the largest homebuilders in America are working to move inventory. The buyer's surprise, .. the math that traps the 2021 and 2022 buyer at the closing table. The consumer stress stack building underneath everything. The equity illusion that makes homeowners feel protected when the cushion is quietly thinning. And the HELOC trap that converts a financial problem into a property problem without most borrowers fully understanding what they signed. (Phewww)
Today I want to put every piece on the table and show you the picture they form together.
Because when you see these not as separate market observations but as a single connected chain of cause and effect, … the picture becomes very clear. And very important to understand before it arrives at your front door.
Here is the sequence.
Stage One. Job losses are accelerating.
Over 1.1 million job cuts were announced in 2025. That is the highest total since the pandemic year of 2020 and before that 2009: .. a list that also includes 2001, 2002, and 2003. These are not good years to be on that list.
White collar employment: professional, managerial, administrative, financial, has contracted for 31 consecutive months. That is nearly three years of sustained contraction in the exact employment category that drives home purchases in the $600,000 to $1.5 million range. The people losing these jobs are not warehouse workers or hourly employees. They are the people who bought the homes I am describing in this series.
Unemployment reached 4.6% in November 2025: a four-year high. The hiring rate is hovering near levels last seen in 2013. Artificial intelligence is not a future threat to this employment category. It is an active and accelerating present one. The World Economic Forum projects that 41% of employers intend to reduce staff due to AI displacement within five years. We are already inside those five years.
Stage Two. Debt service fails.
When income stops or drops, even temporarily, .. the monthly obligations do not stop. They continue arriving. The credit cards that were already at record levels become unserviceable. The auto payment that was already stretched becomes the first thing to miss. The insurance premium that already doubled becomes the bill that gets deferred.
Auto delinquency at 90 days or more is at its highest level since the Great Recession. Auto repossessions at their highest since 2008. Credit card delinquency flowing into collections at a rate not seen in over a decade. Bankruptcies up 15% year over year and accelerating toward pre-pandemic levels.
This is Stage Two. And it is not coming. It is here.
Stage Three. Forced listings emerge.
Here is where the housing market begins to feel it directly.
The homeowner who loses income does not immediately list their home. They use savings first: (Mistake in my humble opinion). Then they max the credit cards. Then they open the HELOC as I described in Piece 8. Each of these moves buys time. Months. Sometimes more than a year.
But each move also tightens the trap.
When savings are gone, cards are maxed, and the HELOC is drawn, .. the monthly financial obligation on the home itself becomes unsustainable. The mortgage. The HELOC payment. The insurance. The HOA. The property taxes. The utilities. All of it together on an income that has been disrupted or eliminated.
At that point the listing is not voluntary. It is not strategic. It is the only remaining option. And the seller in that position is not negotiating from strength. They are negotiating from desperation. They will accept below market. They will concede on everything. They need to close.
That is where distressed inventory comes from in a market like this one. Not from a crash. From a slow methodical accumulation of homeowners who ran out of road one at a time.
Stage Four. Inventory surges.
This stage is already measurable and the numbers are moving.
Active listings climbed over 15% in 2025. Foreclosure filings rose 19% year over year. The spring 2026 inventory levels are tracking above 2025 at every point in the calendar so far. The wave is not crashing. It is rising. Steadily. Monthly. Without the dramatic headline that would cause most people to pay attention.
The buyer pool has not grown to absorb the additional inventory. Affordability has not improved enough. The mortgage rate has not dropped enough. The demand side of this equation is essentially unchanged while the supply side is gradually expanding.
When supply grows and demand holds flat: … price is the adjustment mechanism.
Stage Five. Price compression.
It is already happening in 35% of major markets.
Jacksonville down year over year. Dallas down. Austin. Tampa. Cape Coral. Arizona. Nevada. The Sun Belt markets that saw the most aggressive appreciation in 2021 and 2022 are leading the softening because they also saw the most speculative buying and the most new construction supply entering the market simultaneously.
In the remaining 65% of markets prices are flat to modestly positive in nominal terms. But flat in nominal terms while insurance costs rise 10% annually (being conservative) and property taxes adjust upward is negative in real terms. The homeowner who believes their value is holding steady is losing ground in purchasing power every month even without a price decline.
Price reductions are becoming the norm rather than the exception. Days on market have stretched from 30 days in 2021 to over 90 days in many markets today. Seller concessions: rate buy downs, closing cost contributions, repair credits, are standard requests from buyers who understand the leverage has shifted.
Stage Six. Equity evaporation.
As prices compress the equity cushion thins. The $17.7 trillion peak is already declining. The homeowner who has been watching their Zillow estimate with satisfaction is watching a number that lags the actual market by months. By the time the estimate reflects the real softening the window to act at the higher number has already closed.
319,000 homes fall into negative equity on a 5% further price decline from current levels. In the markets where prices are already falling that 5% is not theoretical. It is the trajectory of where those markets are already headed.
And equity evaporation feeds directly back to Stage One.
The homeowner who has lost equity confidence spends less on discretionary items. Consumer spending contracts. Small business revenue drops. Payroll decisions get made. More layoffs. More debt stress. More forced sellers. More inventory. More price compression.
The cycle tightens.
Now I want to be precise about what I am describing and what I am not.
I am NOT describing 2008.
In 2008 the mechanism was different. Adjustable rate mortgages resetting. Subprime paper comprising 26% to 40% of the market. Zero equity positions across millions of homes. Mass unemployment arriving fast and deep. The dam broke and the water moved all at once.
This market has none of those structural vulnerabilities. The mortgage quality is fundamentally different. 92% of current loans are fixed rate. The vast majority of homeowners who bought before 2020 have substantial equity cushions built over years of appreciation. The banks have learned from 2008 and are extending, modifying, and deferring rather than foreclosing at scale.
What I am describing is a SLOW erosion. Quiet. Patient. Unfolding underneath the surface while most people assume things are fine because the headlines are not screaming.
The equity declines gradually. The forced sellers arrive in small waves. The inventory builds incrementally. The prices soften incrementally. The cushion thins incrementally.
By the time the cumulative effect is visible to the average homeowner the best window to make an informed decision will have already passed.
That is what 30 years of pattern recognition is telling me.
That is what the data across every category I have shown you this week is confirming.
I hope I am WRONG!!
Tomorrow evening: the final piece. The only one that tells you what to do with all of this.
S U N N Y YI
Continue reading:
Piece 10: The Honest Conversation: is the final piece in this series (will be shared tomorrow). It is the only one that tells you what to do with everything I have laid out this week. Share this series with anyone you believe needs to see it. And when you are ready for a direct, honest conversation about your own situation, … reach out. That is what I am here for. Quietly & respectfully …..

The HELOC Trap? All depends how you structure & purpose use
Can't sell. Debt accumulating. So they borrowed against the house to survive.
Here is what comes next.
HELOC originations grew 15.8% last year. 39% of borrowers did it to consolidate debt, not improve their home. The move that feels like relief is quietly building a wall they cannot see yet.
This is the piece I have been building toward all week.
Not because the data is the most dramatic. Because this specific decision, the one thousands of homeowners are making right now, quietly, reasonably, with the best intentions, is the one that concerns me most as someone who has watched market cycles for 30 years.
Let me walk you through exactly what is happening and why.
The setup is everything I have already described.
The homeowner cannot sell. The 3% mortgage rate they locked in is too valuable to surrender. The monthly cost of living has climbed: insurance, groceries, car payments, utilities, and the gap between income and expenses is being bridged with credit card debt. The balance is climbing. The interest at 23% + is compounding. The pressure is building every single month.
So they call the bank.
And the bank, which has been marketing this product aggressively, because there is $11 trillion in tappable home equity sitting in American homes right now: offers them a solution.
A HELOC. A home equity line of credit. At 6.75% to 10% interest.
Versus the 23+% they are currently paying on the cards.
The math is straightforward. Pay off $60,000 in credit card debt at 23% interest with a HELOC at 9%. The monthly payment drops significantly. The breathing room returns. The relief is immediate and real.
I understand completely why they do it.
I would probably consider it myself.
But here is what changes in that single transaction that the bank does not explain clearly: and that most borrowers do not read carefully enough in the paperwork.
That credit card debt was unsecured.
Unsecured means the debt is attached to you, not to any asset you own. In a genuine financial catastrophe, a job loss that doesn't recover, a medical crisis, a business that fails, unsecured debt has an exit. It is painful. It is damaging. But bankruptcy exists as a last resort and unsecured debt can potentially be discharged through that process.
The HELOC is secured by your home.
The moment you sign that document your home becomes the collateral for debt that used to be free floating. There is no discharge. There is no exit that does not involve either selling the property or losing it. You have converted a financial problem into a property problem. And those two things are not the same.
Now let me show you the three traps inside the HELOC that most borrowers walk into without realizing they are there.
The first trap is behavioral and it is the most common.
The majority of people who pay off credit cards with a HELOC or home equity loan refill those credit cards within 18 to 24 months. The cards feel clear. The spending patterns that created the balance in the first place have not changed. Within two years the HELOC is running and the credit cards are climbing again.
Now they have both.
The total debt is higher than when they started. And the home is now securing part of it.
The second trap is structural and it is built into every HELOC contract.
Most HELOCs have a draw period, typically 10-15 years, during which the borrower makes interest only payments. This keeps the monthly obligation manageable and creates the feeling that the situation is under control. What borrowers do not fully internalize is what happens when the draw period ends.
The repayment period begins. Full principal and interest. On the entire outstanding balance. The monthly payment can jump 40% to 60% overnight, .. not because anything went wrong, but because the contract always said it would. On a budget that was already stretched before the HELOC existed, that payment shock can be the event that breaks everything.
The third trap is what happens at the closing table.
Every dollar drawn on a HELOC is a dollar that must be repaid in full when the property sells. It sits on title as a second lien behind the first mortgage. When the homeowner eventually sells, voluntarily or by necessity, the first mortgage gets paid, the HELOC gets paid, the cost of sale gets paid, and whatever remains is the seller's net proceeds.
Here is what that math looks like on a real scenario.
(Example)
A homeowner bought in 2021 for $550,000. Their first mortgage balance today is $490,000. They opened a $65,000 HELOC in 2024 to consolidate debt. Total liens on the property: $555,000.
The current market value of the home after modest softening: $522,000.
They are already underwater before the cost of sale.
Add 7% cost of sale: $36,540 .. and they need $591,540 in gross proceeds to break even at closing. The market will pay $522,000. The shortfall is $69,540.
They cannot sell. They cannot refinance. They cannot exit without cash they do not have. The HELOC that felt like a solution has become the wall.
And here is the number that tells you how many people are walking into this right now.
HELOC originations grew 15.8% last year, the sixth consecutive quarter of growth. The stated reason for tapping equity shifted dramatically. In 2022, 65% of borrowers said they were doing home renovations. By 2024 that dropped to 46%. Debt consolidation as the stated purpose jumped from 25% to 39% of all HELOC borrowers.
They are not improving their homes.
They are surviving with their homes.
And the banks are actively marketing this product to them, because $11 trillion in tappable equity is sitting there and the margins on HELOC originations are attractive. The consumer sees relief. The lender sees opportunity. Nobody in that transaction is explaining what happens when prices soften another 5% and the second lien makes an already impossible exit completely unreachable. Obviously, if you have 50% or more in equity, the scenario changes.
I am not saying do not use a HELOC. There are situations where it is the right tool used correctly for the right purpose.
I am saying, if you are considering opening one to manage the debt squeeze I described in Piece 6, please have the full conversation before you sign. Model the closing table scenario. Understand what your exit looks like if you need to sell in the next three to five years. Know what you are converting and what you are giving up in that conversion.
Because the wall is not visible until you are standing directly in front of it.
Tomorrow morning I connect every piece of this series into a single sequence. The cascade. How job losses lead to debt failure, how debt failure leads to forced listings, how forced listings lead to inventory, how inventory leads to price compression, and how price compression leads to the equity evaporation I described in previous piece.
When you see it as one connected chain you will understand exactly where this market is and where it is going.
That is Piece 9. The Cascade.
S U N N Y YI
Continue reading: Piece 9: The Cascade … connects every piece of this series into a single sequence. It is the clearest picture of where this market is and where it is headed. If you know someone who is considering tapping their home equity right now to manage debt, share this article with them before they make that decision. And if you want to talk through your own situation honestly, reach out directly. No pitch. No pressure. Just 30 years of experience and a straight answer.

The Equity Illusion.
The number everyone is banking on, and what is quietly happening to it right now.
$17.7 trillion in homeowner equity. Declining by $78.8 billion in 2025. 35% of major markets already seeing price drops. The cushion is real. And it is shrinking.
I want to be careful with how I say this because it requires precision.
Homeowner equity in America is real.
The number: $17.7 trillion at its recent peak, represents genuine value built over years of appreciation. Many of the people reading this are sitting on that equity right now. It exists. I am not telling you otherwise.
What I am telling you is what it cannot do. And what is quietly happening to it month by month while most homeowners assume it is holding steady.
Let me start with what equity cannot do.
It cannot pay your insurance premium. It cannot cover the gap between your grocery bill and your paycheck. It cannot service a credit card running at 23% interest. It cannot make your car payment. It sits inside your home: paper wealth, real value, completely inaccessible unless you sell the property or borrow against it.
And here is the critical point that most homeowners miss.
Borrowing against it costs money. A HELOC today carries an 6.75% to 10% interest rate. A cash out refinance means giving up the 3% mortgage rate you have been protecting for three years and replacing it with a 6.75% rate on the entire loan balance. Neither option is free. Neither option is without consequence. The equity is there on paper. Accessing it is expensive in ways that most people do not fully calculate before they act.
Now here is what is happening to the equity itself.
Homeowner equity declined by $78.8 billion in 2025. That number may sound abstract against a $17.7 trillion backdrop. It is not abstract when you understand what is driving it.
In 105 of the 300 largest housing markets in America, home prices are falling year over year right now. That is 35% of all major markets. Declining. Not in 2008. Today. In 2025.
The markets leading the decline are not random. They are concentrated in the Sun Belt and Gulf Coast: the exact cities where buying was most frenzied in 2021 and 2022. Jacksonville. Dallas. Austin. Tampa. Cape Coral. The same markets where buyers were paying $50,000 over asking price four years ago are now watching values drift in the wrong direction.
And here is the number that concerns me most as someone who has watched equity positions across multiple market cycles.
319,000 homes in America would fall into negative equity: meaning the owners would owe more than the home is worth: on just a 5% additional price decline from where we are today.
Read that again.
Not a crash. Not a 2008 style collapse. A 5% further softening from current levels. And 319,000 families cross from equity positive to underwater.
The equity rich share of American homeowners: those with a meaningful cushion above their mortgage balance, is at its lowest level since the fourth quarter of 2021. It has been declining for over three years. Quietly. Without headlines. While homeowners look at their Zillow estimate and feel reassured.
Here is what I want you to understand.
The equity is not gone. It is not fabricated. But it is no longer the permanent, growing, untouchable cushion that the last four years of appreciation made it feel like. In a significant portion of the country it is actively declining. In markets that saw the highest appreciation it is most vulnerable to the softening that is already underway.
The homeowner who is banking on equity as their safety net needs to ask one question.
Is that equity accessible if I need it? And at what cost?
In many cases the answer is: not easily. Not cheaply. And not without consequences that most people have not thought all the way through.
Future post: I will show you the specific move thousands of homeowners are making right now in response to exactly this pressure. They are tapping equity to manage the consumer stress I described in previous piece. And the way they are doing it is creating a new layer of risk that most of them do not see until it is directly in front of them.
That is Piece 8. The HELOC Trap or option.
Important piece.
S U N N Y YI.COM
Piece 8. The HELOC Trap: is the next article in this series and the one I maybe the most important warning in the full 10 piece breakdown pending how one position themselves with this option. If someone you know is considering tapping their home equity to manage debt right now, please share this series with them before they make that decision. THE HELOC can also be advantageous. Why use your own funds when you can create future options. And if you want to talk through your own situation honestly, .. reach out. That is what I am here for.

The Consumer Stress Stack.
What is happening underneath the housing market that most homeowners haven't connected yet.
A $20 Subway sandwich. A $772 avg. monthly car payment. A credit card running at 23% interest. This is not a housing story. Until it is.
I want to step back from real estate for a moment.
Not because it isn't relevant. Because what is happening in the consumer economy right now is the foundation underneath everything I have been describing this week. And most homeowners have not connected these two things yet.
Let me show you the connection.
First: what you already feel.
You feel it every time you walk into a grocery store. The bill that used to be $200 is now closer to $400. You feel it when the insurance renewal arrives: the home premium that used to be $3800 a year is now pushing $7000 - $9000, and in California, Florida, and Texas it has effectively doubled for many homeowners. You feel it at the gas station, at the restaurant, at the hotel. The $400 hotel room is $800. The $150 dinner is $300. The Subway sandwich that used to be $5.99 is approaching $20.
You feel it. But you may not have measured it.
Here is what the data says underneath the feeling.
American consumers are currently carrying $1.28 trillion in credit card debt. That is not a misprint. $1.28 trillion. A record high. Up 66% since January 2021. The average interest rate on that debt is 23.4% .. also a record. The people carrying that balance are not paying it down. They are servicing the interest and watching the principal grow. (Buying time)
Auto loans tell an even starker story. 90 day delinquencies: borrowers more than three months behind on their car payment are at their highest level since the Great Recession of 2008 and 2009. Auto repossessions hit 1.73 million last year. That is the most vehicles repossessed in a single year since 2008. These are not subprime borrowers on the margins. These are middle-class families who bought vehicles at peak pandemic prices with payments averaging $772 a month and are discovering that number is no longer sustainable.
Bankruptcy filings are up 15% year over year. Small business filings are up nearly as much. The businesses owned by the people in your neighborhood: the ones who bought homes during the run-up .. are feeling the revenue compression that comes when consumers stop spending. Less revenue means tighter payroll. Tighter payroll means decisions about who stays and who goes.
And real wages: the actual purchasing power of a paycheck after inflation is accounted for are still negative compared to January 2021. People are earning more dollars. They are buying less with them. The gap between what things cost and what paychecks deliver has been bridged almost entirely by credit. Which is why the credit card number is where it is.
Now here is the direct connection to housing.
The consumer who is maxing credit cards to cover groceries and insurance is not walking into Home Depot to update a kitchen before listing. The consumer who is 90 days behind on a car payment is not qualifying for a mortgage on a new purchase. The small business owner whose revenue dropped 20% this year is not making confident real estate decisions.
And the homeowner who feels the monthly squeeze, who watches every bill climb while the paycheck stays roughly the same, is increasingly doing one thing with their home equity.
They are borrowing against it.
Not to improve the home. Not to invest. To survive the gap between what things cost and what they earn.
That move: the HELOC taken out to pay down the credit cards is the subject of Piece 8. And it is the most dangerous development I am watching in this market right now.
But before we get there, I want to show you the number that homeowners are banking on, .. the equity cushion that makes everyone feel safe, and what is quietly happening to it beneath the surface.
Because the cushion is real.
And it is shrinking.
The full series continues below. Piece 7 is next.
S U N N Y YI.COM
Continue reading: Piece 7: The Equity Illusion, is the next article in this series. The full 10 piece breakdown lives here at 91326pr.com. If this series is landing for you, share it with someone who needs to see it. And if you are ready to have an honest conversation about your specific situation, reach out directly. No pitch. No pressure. Just 30 years of experience in your corner privately.

Piece 5 of 10 — Coachella Edition
If you bought a second home in Coachella Valley between 2021 and 2023, a meaningful portion of your down payment may already be gone.
Here is the math nobody walked you through.
This is Piece 5 of 10.
I want to write this one specifically for the desert.
The buyer who flew in from LA, Seattle, the Bay Area, Vancouver, or somewhere east, and bought a second home in Coachella Valley between 2021 and 2023, put down something serious. 25% on a second home was not optional. On a $1,800,000 home in La Quinta or Rancho Mirage, that was $450,000 cash out of your account at closing.
Three years later, many of those owners are sitting in a market that doesn't look like the one they bought into. The home has softened. The HOA went up. The insurance went up. The property tax did its normal thing. And the quiet question that comes up, when no one else is in the room, is the same one every time.
"If I sold today, where would I land?"
So let me walk you through it. Honestly. No agenda.
There are three forces working against your equity from the day you bought. Most owners only see one.
The first is price erosion.
In 2021 and 2022, Coachella Valley saw buyers paying $50,000 to $200,000 over asking. Bidding wars on PGA West resales, certain Madison Club listings, gated sections throughout Rancho Mirage and Indian Wells, new construction across La Quinta. Emotion was driving decisions and supply was nothing.
That has changed. Coachella inventory is sitting around 2,900+ active listings as of this writing. Days on market are stretched. Multiple offers are gone except at very specific entry-level points. Sale prices are 5% to 10% off 2022 peaks in many communities, and more in some.
A modest 7% softening on a $1,800,000 purchase erases $126,000 of paper value before anything else happens.
The second is the amortization trap.
This is the one nobody talks about.
On a 30-year fixed mortgage at 5.5% (a typical second-home rate in 2022) on a $1,350,000 loan, your first three years of payments are almost entirely interest. You sent the bank approximately $276,000 in payments over those 36 months. Roughly $58,000 of it touched your principal. The rest is gone.
Most buyers think principal pays down steadily. It does. Very slowly. The amortization curve is unforgiving to anyone who needs to exit inside the first five years.
The third is the cost of sale.
Selling a Coachella home costs between 5% and 6.25% of the sale price by the time you add commissions, escrow, title, transfer taxes, HOA disclosure fees, and the buyer concessions that have quietly become standard.
On a home that closes at $1,674,000, that's $84,000 to $105,000 out before you see a dollar of net.
Now put all three together on one scenario.
Purchase price 2022: $1,800,000
Down payment 25%: $450,000
Loan balance after 3 years: $1,292,000
Current market value at 7% softening: $1,674,000
Cost of sale at 6.25%: $104,625
Buyer concession: $25,000
Net proceeds: $252,375.
You put $450,000 down. You walk away with $252,375. The difference, $197,625, is the portion of your down payment the market quietly took back.
You didn't write a check at closing. You didn't lose the house. You didn't go into foreclosure.
You lost 44% of your down payment.
And depending on the community, the builder, the original purchase number, that figure can be worse. Certain PGA West sections. Specific Indian Wells gated communities. New construction in La Quinta. Coral Mountain. Specific Trilogy and Sun City phases. The math moves with the zip code, the community, and the developer concession that was already running when you bought.
Most owners in this position don't know the math until they sit in front of it. They look at the Zillow estimate, see something close to what they paid, and assume they're made whole. They're not. The number on the screen is not the number at the closing table.
If you bought in Coachella Valley between 2021 and 2023 and have been thinking about selling, please have this conversation before you list. Not after.
Not to list your home. Not to talk you into anything. To show you the actual math on your specific property in your specific community, so the decision gets made from clarity instead of hope.
That is what I am here for.
I'm here when it matters.
S U N N Y YI

Largest home builder is spending on average $47,000 per home just to get a buyer to the closing table.
When the largest homebuilder in America is that aggressive, you should pay attention.
Don’t get too fixated on the numbers themselves. What really matters is the mindset driving them and what it reveals beneath. This isn’t about generosity from builders; it’s a response to market forces shaping their decisions.
Let me tell you something about homebuilders that rarely gets said plainly.
They are not your competition in a normal market. In a normal market, new construction and resale exist in different lanes. The buyer who wants a brand new home is not the same buyer shopping resale. They serve different needs.
This is not a normal market. In 2025, the builders have become the market. And what they are doing to survive tells you everything about where we actually are.
D.R. Horton: the largest homebuilder in America by volume: disclosed that 73% of their buyers in the last quarter received a mortgage rate buydown paid for by the builder. Not by the bank. Not by a government program. By D.R. Horton. Out of their own margin. Lennar, the second largest builder, is spending an average of $47,100 per home in buyer incentives. That is 10.1% of the average sale price. In Texas it hit 16.9%. Toll Brothers, which builds luxury homes averaging close to $1 million, is offering $50,000 in design credits to get a buyer under contract.
These are not small concessions. These are companies absorbing losses on their margin to move inventory because the buyer will not move without help.
And here is the part that directly affects every resale seller: including many of you reading this.
Your listing is competing against that.
A buyer standing between your resale home and a new build down the street is being offered a 3.99% - 4.99% mortgage rate (rate buy down), $50,000 in design credits, and a brand new home with a warranty. You are offering a home someone else lived in, at market price, with no incentives.
That is not a fair fight. And most sellers don't even know it's happening.
The builders are telling you something with these numbers. They are telling you the buyer needs to be carried to the closing table right now. The buyer does not have enough confidence or enough purchasing power to get there on their own. That is not a sign of a strong & healthy market. That is a distress signal.
Next: I will show you the math that is trapping the buyers who already closed: the ones who bought in 2021 and 2022 and are now discovering what it actually costs to sell.
S U N N Y YI.COM

When the housing market is healthy, people spend money at Home Improvement Stores.
Appliance sales have dropped three years in a row ($1000 plus purchases)
Small percentage: getting their home ready to sell.
Most people look at the housing market through one lens: home prices. Are they up or down. I look at different signals. The ones that don't make headlines but tell you exactly what's really happening on the ground. Home Depot and Lowe's are two of those signals. Here's what they're telling me right now. In a healthy housing market, homeowners spend money. They update the kitchen before listing. They replace the aging appliances. They put in new floors, new fixtures, new bathrooms. They prep the home to sell, and they do it at Home Depot and Lowe's (other well known home improvement stores).
That spending has stopped. Home Depot's appliance sales have declined three consecutive years. Their comparable store sales: the number that tells you whether existing stores are growing, are down 2.5%. Lowe's is down 3% to 3.5%. The DIY consumer, the one renovating and improving, has essentially disappeared.
What's left? The professional contractor fixing what breaks. The homeowner patching the roof, not because they want to, but because they have to. That is not a growing market. That is a maintenance market. And here is what this tells me about the sellers. They are not spending money to prepare their homes for sale. Not because they don't have the money. Because they are not selling.
They have decided, consciously or not, that the cost and the math of moving doesn't work for them right now. And the buyers? They aren't updating either. Because in many cases they are not buying.
The store that profits most when homes trade hands is not profiting. That is not a headline you will read everywhere. But it is one of the clearest confirmations I have seen that what I described in Piece 1: the frozen market is real. It is measurable. And it is showing up in the earnings reports of two of the largest retailers in America.
3 & 4 of 10 will be shared tomorrow. I'm going to show you what the biggest homebuilders in America are doing to un load their inventory. And, what it means for every resale listing competing against them.
S U N N Y YI.COM
Your mortgage rate is the best thing that ever happened to your house.
It may also be the thing that traps you in it for decades?

Over the next five days I'm releasing one piece of a puzzle at a time. Each piece tells you something the industry isn't saying out loud. There is a term making the rounds in economic circles right now. I call it: The "Golden Handcuff." It describes something I have never seen in 30 years of doing this: a market where the very thing that should motivate people to move is the exact reason they can't. Here is what I mean. 54% of homeowners in America today have a mortgage rate below 4%. Many of them locked in at: 1.95% - 3.00 % rates, .. that will never exist again in their lifetime.
(Example) On a $1,500,000 loan, that rate means a monthly payment of roughly $2,670 difference from 3% vs 6% ... Forever. So they don't move. Not because they don't want to. Not because they don't need to.
Because the math of moving doesn't work. Trading your 3% mortgage for a 6.00% (+) mortgage on your next home feels like voluntarily taking a pay cut: every single month, .. for the rest of your loan. So the seller stays. And the buyer waits. And the market: which needs both of them to function, .. sits still.
In 2025, existing home sales hit their lowest level since 1995. Not since the crash. Since 1995. There are 1.7 million home sales that should have happened in the last two years that simply didn't. The market isn't moving slowly. It's barely moving at all. I call it the drip system. In a healthy market, homes flow: starter home to move-up to luxury. Each transaction creates the next one. The system circulates.
In this market, that flow has nearly stopped. Every segment is waiting on the one above it. Nobody is moving. Nobody is spending. Nobody is pulling the trigger. And here is what concerns me most. The people inside this market: the ones sitting on paper equity, the ones holding their 3% rate like a lifeline: .. many of them believe everything is fine. It isn't fine. It's frozen. And frozen isn't the same as fine.
My 2 of 10 next post: I'll show you what the data at Home Depot and Lowe's is telling us, and why two of America's largest retailers are quietly confirming everything I just described.

Something Is Wrong With This Market.
I'd Rather You Know Now Than Find Out Later.
I've been in real estate for over 30 years.
I've lived through every cycle. The crash. The recovery. The run up. The corrections nobody saw coming and the ones everybody saw and ignored anyway.
I've never seen a market like this one. Not because it's collapsing. Because it isn’t. Its the longest run I’ve experienced in 30 years.
And that's exactly what makes it dangerous.
The sellers think their equity is protecting them. The buyers think waiting is the smart move. The homeowners who can't sell are finding other ways to survive: ways that are quietly making their situation worse.
Nobody is talking about this plainly. Not the industry. Not the headlines. Not the agents who have something to sell you.
So I'm going to.
Over the next 5 days, I'm releasing 10 pieces of a puzzle: one piece at a time. Each one will make you think. All 10 together will change how you see what's actually happening in this market right now.
I'm not writing this to scare you.
I'm writing this because after 30 years, I've learned that the most dangerous thing in real estate is not a bad market.
It's not knowing what market you're actually in.
The full picture lives here:
Piece 1 drops tomorrow morning.

Waiting for the headline will be the biggest mistake
Housing Market Update
The signs are everywhere. Most just don’t want to see them yet.
What’s Already Happening (Nationally)
Markets starting to shift & been happening:
Arizona
Florida
Austin
Tennessee
Colorado
Inventory is rising
Homes are sitting longer
Price reductions are increasing
California Is Not Immune
Especially in secondary and lifestyle markets:
Coachella Valley
Mammoth Lakes
Big Bear Lake
Lake Tahoe
What we’re seeing:
Inventory has already surpassed pre-pandemic levels (as of 2025)
Some owners are approaching, or already in negative equity positions
Active Inventory for Coachella Valley
PS: 796 CC: 222 RM: 447 PD: 831 IW: 135 LQ: 507 = 2938
Where the Risk Sits
Buyers from 2021–2023 are the most exposed: (unless you exercised the "Kim-Chee" theory by Sunny Yi)
Bought at peak pricing
Locked into higher payments
Now facing a different market
This is how declines spread: quietly at first …
Pressure Building Underneath
$1.7T in credit card debt (record high)
Early signs of stress in white collar employment
A growing gap between income and affordability
Equity is strong, until it isn’t.
That changes if:
Job loss picks up
Payments become unsustainable
Consumer debt hits the ceiling
What Actually Matters Now
For Sellers:
The market doesn’t forgive overpricing anymore.
You either position correctly, or you sit.
For Buyers:
Waiting for confirmation usually means paying for it.
The best entries don’t come with headlines.
Bottom Line
Most people react late. That’s where mistakes happen.
I focus on what’s moving before it’s obvious.
My mother: "You make you money when you buy, not, when you sell"
How you purchase is critically important in any market.
Stay close to the signal.
Find me when it matters

Coachella Valley Inventory UPdate: 4/2/2026 @ 5:06pm.
Palm Springs: 789
Cathedral City: 231
Rancho Mirage: 436
Palm Desert: 836
Indian Wells: 138
La Quinta: 494
Total for sale: 2924
Lets compare ..
2019: 2600-ish for sale
2021: July: 625 for sale
2021: Oct: 730 for sale
2022: June: 922 for sale
2022: Nov: 1685 for sale
2023: Oct: 1488 for sale
2024: Feb: 1920 for sale
2025: May: 3134 for sale
The Market Isn’t Breaking, It’s Quietly Repricing
After five market cycles, I’ve learned to pay attention when patterns begin to repeat.
And today, those patterns are beginning to surface again.
Not panic.
Not collapse.
Just pressure.
If I had to describe this market in one word:
Fatigue.
People are getting tired.
Consumers are stretched … not broken.
Still managing. Still holding on.
But pressure, over time, has a way of revealing what’s sustainable … and what isn’t.
My role isn’t to predict or alarm.
It’s to help you recognize the moment when preparation turns into opportunity.
What I’m Watching Right Now
Not headlines.
Not opinions.
Trends.
1) Auto Loans: Where Stress Begins
This is usually where cracks show first.
Delinquencies (90+ days): 5.2% (near 2008 levels)
Total auto debt: $1.67 trillion
Repossessions: highest since 2009
Many buyers from 2022 are already in negative equity.
2) Private Credit: Liquidity Tightening
This is a trillion dollar space most people don’t see in the news
Loans made outside traditional banks
Faster, more flexible… but higher risk
Underwriting loosened during 2020–2022
Now:
Defaults are rising
Investors are having difficulty pulling money out
Estimated stress: $100B+ range
3) Credit Cards: Stretch, Delay, Juggle
Total debt: $1.3 trillion (highest ever)
Delinquencies rising sharply
Up over 60% since 2021
This is no longer lifestyle spending.
This is survival debt
4) Second Home Markets: Early Pressure
(Coachella Valley, Tahoe, Mammoth)
Inventory: above pre-pandemic levels
Days on market: increasing
Price reductions: increasing
But here’s what most people miss:
The data is misleading.
Example:
Listed: $1.8M
Reduced to $1.5M
Re-listed to $1.4M
Sold: $1.35M
Reported:
96% of list price
Reality:
75% of original asking value
This is happening more than people realize.
5) New Construction: Most Vulnerable
Buyers from 2022 paid:
Builder premiums
Lot premiums
Design center upgrades
All financed into the purchase.
Today:
Competing with lower priced resale (2019 - 2020 purchases)
Facing softer demand
Many are experiencing negative down payment
Risk by Area (Simplified)
Higher Risk
Coachella Valley
Riverside / Antelope Valley
New construction (2022 purchases)
Medium Risk
Santa Clarita
Simi Valley
Porter Ranch (newer communities)
Lower Risk
West LA
Core San Fernando Valley (entry-level)
This Is NOT 2008
Let’s be clear.
Foreclosures: rising
Delinquencies: rising
Pressure: real
But:
Nowhere near 2008 levels
This is early stage pressure.
6) .COM vs AI bubble
Then: The internet will change everything
Now: AI will change everything
Both are TRUE … but:
Truth + hype = overpricing
Capital flooding into one theme
Dot-com: anything with “.com” went up
Today: anything tied to “AI” gets premium
It’s a “valuation bubble”
What Will Determine What Happens Next
Not price.
Not headlines.
I watch for Behavior.
Watch for:
Homeowners giving up 3% mortgages
White-collar layoffs (tech, finance)
Builder incentives increasing
Inventory quietly building
Deals falling out of escrow
What Matters Most: Time
Time reveals everything.
How long sellers hold
How long buyers wait
How long properties sit
Over time, pressure turns into fatigue
Fatigue turns into decisions
Decisions create supply
Final Thought
This market isn’t breaking.
It’s adjusting. Quietly.
And when that adjustment turns into action …
the opportunity won’t be obvious
but it will be there (if & when it does show up)
Homes selling? yes ..
Connect when it matters
S U N N Y YI
Negative Down Payment & Negative Equity
By Sunny Yi
Many homeowners spent years saving for their down payment.
Today, some are discovering that when they sell, that down payment may not fully come back to them.
After nearly 30 years in real estate, I’m seeing two situations quietly appearing across parts of Southern California - particularly in areas like Coachella Valley, San Fernando Valley, Santa Clarita, Antelope Valley, and, certain areas of West Los Angeles.
These situations are often confused, but they are very different.
1. Negative Down Payment
A Negative Down Payment means the homeowner can still sell their property without bringing additional cash to closing.
However, a portion of their original down payment will be used to cover the difference between the purchase price and today’s market value, along with selling costs.
In other words:
The seller does not receive their full down payment back.
Part of it is absorbed by the market correction and transaction costs.
2. Negative Equity
Negative Equity is more serious.
This happens when the home’s value is below the remaining mortgage balance plus selling costs.
In this case, the seller must bring additional cash to closing in order to complete the sale.
Why This Is Happening
Buyers who purchased between 2021 and 2023 often bought at peak prices during an extremely competitive market.
Some used smaller down payments or purchased new construction at full list price plus lot premium.
As the market normalized, certain neighborhoods corrected more than others.
That’s why this issue is highly zip-code dependent.
Where I Am Seeing It
This is not happening everywhere, but it is appearing in specific areas including:
• Coachella Valley and new construction communities
• Porter Ranch newer construction neighborhoods/San Fernando Valley
• Santa Clarita Valley
• Antelope Valley
• Parts of Riverside County and the Inland Empire
In these markets, some homeowners are discovering that selling today requires careful planning and honest pricing from the start.
What Homeowners Should Do
This is not a crisis.
Most homeowners in Southern California still hold positive equity.
But if you purchased between 2021 and 2023, it is important to understand your true equity position before making any decisions.
Online estimates rarely tell the full story.
Every neighborhood behaves differently.
My Role Today
Information is everywhere now. Everyone has data.
What homeowners need today is not more data.
They need someone who can help them protect their equity and avoid financial mistakes. I offer judgement. And, judgement comes from experience. After successfully navigating through (5) market cycles, the market leaves footprints. Market positioning is crucial. If you’re seeking a salesperson, you have 1000’s of choices.
If you purchased in the past few years and want a clear advisory picture of where you stand, I’m always happy to have a straightforward conversation about your options without ulterior motives.
No pressure. No surprises. Just clarity.
S U N N Y YI
A Quiet Market Reality Some Southern California Homeowners Are Facing

How One Extra Mortgage Payment Can Save You Hundreds of Thousands
Example Loan
Loan Amount: $1,000,000
Interest Rate: 5% Fixed
Loan Term: 30 Years (360 Months)
Monthly Principal & Interest Payment: $5,368
Lifetime Cost of This Mortgage
Category Amount Total Payments Over 30 Years $1,932,558 Total Interest Paid $932,558
Key insight:
In the early years of a mortgage, most of your payment goes toward interest — not principal.
What Happens If You Add $500 Per Month
New Monthly Payment: $5,868
Result Outcome Loan Payoff Time: 24 Years 10 Months. Time Saved: 5 Years 2 Months. Interest Saved: $185,345
By simply adding $500 toward principal each month, you eliminate over five years of payments and save over $185,000 in interest.
Where the Extra $500 Goes
With traditional lenders like:
• Wells Fargo
• Bank of America
• Chase
Your required payment covers:
Interest first
Then principal
Any extra payment goes directly toward principal as long as it is marked correctly.
Always choose:
Apply to Principal Only
Otherwise the bank may treat it as next month's payment, which does not reduce interest.
Why Early Payments Matter
Mortgages are front loaded with interest.
Example first payment on this loan:
Payment Portion Amount Interest: $4,167 Principal: $1,201
That means 78% of the payment is interest in the beginning.
When you add $500:
Principal becomes roughly $1,701 instead of $1,201, which accelerates the loan dramatically.
Strategy Many Homeowners Use
One Extra Payment Per Year
Monthly Payment: $5,368
Extra payment once per year: $5,368
Result:
• Cuts about 4–5 years off the loan
• Saves significant interest
Two Extra Payments Per Year
Instead of:
12 payments × $5,368 = $64,416 per year
You pay:
14 payments × $5,368 = $75,152 per year
Extra per year: $10,736
Result Outcome Years Eliminated: 10 Years. Interest Saved: Over $400,000
Bi-Weekly Payment Strategy
Instead of one monthly payment, some homeowners pay:
$2,684 every two weeks
Because there are 26 bi-weekly periods in a year, you effectively make:
13 full payments per year instead of 12
This also shortens the loan and reduces interest.
Advanced Strategy Some Homeowners Use
Early Principal Attack (First 5 Years)
For the first 5 years:
Regular payment: $5,368
Extra principal: $2,000
Total monthly payment: $7,368
After 5 years, return to the normal payment.
Result:
Outcome Estimate Loan payoff: 20 years. Years eliminated: 10 years. Interest saved: $450,000
This works because reducing principal early in the loan dramatically shrinks future interest.
Real Estate Insight
Many homeowners focus only on interest rate, but payment behavior matters just as much.
Some borrowers prefer to:
• keep a low mortgage rate
• invest extra money elsewhere
Others prefer debt freedom and peace of mind.
The right strategy depends on your financial goals.
I am here when it matters.
Most homeowners never realize how small changes to their mortgage payment can save hundreds of thousands of dollars over time.
Example Loan
Loan Amount: $1,000,000
Interest Rate: 5% Fixed
Loan Term: 30 Years (360 Months)
Monthly Principal & Interest Payment: $5,368
Lifetime Cost of This Mortgage
Category Amount Total Payments Over 30 Years $1,932,558 Total Interest Paid $932,558
Key insight:
In the early years of a mortgage, most of your payment goes toward interest — not principal.
What Happens If You Add $500 Per Month
New Monthly Payment: $5,868
Result Outcome Loan Payoff Time: 24 Years 10 Months. Time Saved 5 Years 2 Months. Interest Saved $185,345
By simply adding $500 toward principal each month, you eliminate over five years of payments and save over $185,000 in interest.
Where the Extra $500 Goes
With traditional lenders like:
• Wells Fargo
• Bank of America
• Chase
Your required payment covers:
Interest first
Then principal
Any extra payment goes directly toward principal as long as it is marked correctly.
Always choose:
Apply to Principal Only
Otherwise the bank may treat it as next month's payment, which does not reduce interest.
Why Early Payments Matter
Mortgages are front-loaded with interest.
Example first payment on this loan:
Payment Portion Amount Interest: $4,167 Principal: $1,201
That means 78% of the payment is interest in the beginning.
When you add $500:
Principal becomes roughly $1,701 instead of $1,201, which accelerates the loan dramatically.
Strategy Many Homeowners Use
One Extra Payment Per Year
Monthly Payment: $5,368
Extra payment once per year: $5,368
Result:
• Cuts about 4–5 years off the loan
• Saves significant interest
Two Extra Payments Per Year
Instead of:
12 payments × $5,368 = $64,416 per year
You pay:
14 payments × $5,368 = $75,152 per year
Extra per year: $10,736
Result Outcome Years Eliminated: 10 Years Interest Saved Over $400,000
Bi-Weekly Payment Strategy
Instead of one monthly payment, some homeowners pay:
$2,684 every two weeks
Because there are 26 bi-weekly periods in a year, you effectively make:
13 full payments per year instead of 12
This also shortens the loan and reduces interest.
Advanced Strategy Some Homeowners Use
Early Principal Attack (First 5 Years)
For the first 5 years:
Regular payment: $5,368
Extra principal: $2,000
Total monthly payment: $7,368
After 5 years, return to the normal payment.
Result:
Outcome Estimate Loan payoff: 20 years. Years eliminated: 10 years Interest saved: $450,000
This works because reducing principal early in the loan dramatically shrinks future interest.
Real Estate Insight
Many homeowners focus only on interest rate, but payment behavior matters just as much.
Some borrowers prefer to:
• keep a low mortgage rate
• invest extra money elsewhere
Others prefer debt freedom and peace of mind.
The right strategy depends on your financial goals.
I am here when it matters.

T R U S T: What Does It Feel Like?
In the real estate industry, we ranked and judged by production: by GCI (gross commission income) by volume, by numbers on a leaderboard. When I first started, there was no time to reflect. There was only time to earn. So, I chased it.
I chased production
I chased transactions
I chased the scoreboard
I chased the award plaques (bigger the better)
Mentality of: NEXT .. NEXT .. NEXT!
Thousands of transactions later: through life experience, maturity, setbacks, growth - I began to understand the deeper questions: what, why, where, when, & how of life. Every person in my circle, personally & professionally is based on trust. That’s when I made a decision. I overhauled my entire business. That’s when S U N N Y YI 2.0 came to life.
T R U S T!
But, what does it actually mean?
Trust is not a slogan
It’s not branding
It’s definitely not a closing gift or a bottle of wine.
Trust is a feeling. So, what does trust feel like?
No surprises
Peace of mind
No “what if”
No anxiety
No sleepless nights
No fear
No apprehension
It’s certainty
It’s a warm protected blanket
It’s calm
It feels like knowing every decision being made is based on one thing only: what is in the absolute best interest of my client and their financial futures.
Not my commission. Not my ego. Not my image. The client’s protection. Period.
We’ve all experienced Michelin three star restaurants and some of the best establishments in the world. It’s not just the product that separate them. It’s the experience. It’s how you felt after the experience. Every detail intentional. Every movement precise. No chaos. No scrambling. No uncertainty. You don’t leave wondering if yo made the right choice.
That is what I want S U N N Y YI to represent.
Not the loudest operation. Not the flashiest. Not the one chasing headlines. Not chasing #1. (By the way: that’s a fictional illusion)
The most trusted: Pre .. During .. Post ..
Every decision and recommendations filtered through one question: does this protect my client?
This is who I am.
Building trust: felt before, during, and long after the transaction is complete.
To strive to be the best in the world as the trusted brand in my industry. That’s the beautiful garden I have committed to create and promise myself.
S U N N Y YI.COM

“The Statistic That’s Quietly Distorting Today’s Housing Market”.
Why 95% - 98% list to sales ratio can be fiction
Inventory Is Slowly Rising: Especially In Secondary Market
Still below true balanced market levels.
Many homeowners are locked into 2–3% mortgages: they’re not selling unless necessary.
We are in a slow moving, selective market.Coachella Valley: surpassed pre pandemic active inventory.
Days on Market Is Extending
Homes are sitting longer.
Buyers are cautious.
Multiple offers are no longer automatic (except for entry-level pricing done correctly).
Position strategy matters more than marketing noise.
Price Reductions Are Increasing
This is the statistic most agents and homeowners miss.
On paper:
Sold price vs. final list price still looks healthy.
In reality:
Many homes have 2 - 4 plus price reductions before selling.
True value discovery is happening during listing life cycle. Not the final list to closing price.
Entry-Level Homes Are Stronger Than Luxury
$600K - $1M range: quicker movement. (Example pending zip)
$2M plus: slower, longer hold times.
Why 95% - 98% + List to Sales Ratio Can be Fiction
It only measures final list price. Most MLS system calculate: sales price divided by final list price. NOT original list price.
So, if a home:
List at: $1,000,000
Reduces to: $900,000
Reduces to: $875,000
Sells at: $860,000
The MLS reports: $860,000 divided by $875,000 = 98.29% list to sales ratio.
In reality: list to sales ratio calculation should be: $860,000 divided by $1M = 86% list to sales ratio.
Underlying Concerns In This Market
Interest Rate Lock - In Effect (Golden handcuffs)
Millions of owners including Porter Ranch: at 2.125% – 3.25%. (During re-fi boom)
They will not move unless:
Divorce
Death
Relocation
Financial pressure
This limits inventory but also limits buyer mobility.
Consumer Debt & Savings Erosion
Credit card balances high (highest ever recorded)
Pandemic savings depleted
Auto delinquencies rising
This doesn’t drastically affect housing, but it reduces confidence.
Psychological Shift
The biggest change is NOT economic.
It’s emotional.
Buyers no longer fear missing out.
They fear overpaying.
That’s a massive behavioral shift from 2020 - 2022.
Today: percentage of owners who purchased in later 2022: witnessing negative downpayment pending city & zip codes here in Los angeles.
New Construction Competition
Builders are:
Buying down rates
Offering design center / landscape incentives
Covering closing costs
Resale sellers can’t compete on financing terms: only on pricing.
What does all this mean:
Personal opinion: We’re in a slow recalibration.
Inventory is rising, buyers are cautious, and market positioning strategy matters more than ever.
Homes that are priced correctly move. Homes priced aspirationally sit.
Guess Where This Could Go After Experiencing (5) cycles
Three possible paths over next 12–18 months:
Rates decline modestly: inventory rises, neutral market
Rates stay high: stagnation continues (most will not be able to sustain)
Economic slowdown: more motivated sellers, softening additional 5–8% - ish in certain areas/zip codes or more. In secondary market: Coachella Valley, Lake Tahoe, Big Bear, Mammoth etc: I am witnessing more aggressive price adjustments in order to liquidate. Especially at the entry level: rate sensitive.
Not 2008 - 2009
More like 1994 - 1996 slow grind
During a meeting a newer agent asked:
What’s the major difference between 2008 -2009 vs 2023 - 2025?
2008: Market Crashed! Certainty 100%
2026: It’s a slow bleed! Uncertainty (never experienced)
I’m here when it matters …..
S U N N Y YI.COM

Coachella Valley inventory Rising
February 26, 2026 @ 1:35PM
Active inventory update:
Palm Springs: 769
Cathedral City: 219
Rancho Mirage: 443
Palm Desert: 836
Indian Wells: 135
La Quinta: 513
Total for sale: 2915 total units for sale
Inventory Growth Over time
July 2021: 625
October 2021: 730
January 2023: 1828
May 2024: 2156
January 27, 2025: 2690 (inventory exceeding pre pandemic invenotry)
March 2025: 2853
April 2025: 2999
May 2025: 3135
November 2025: 2581